


Formula One 1984 Season Map - Every Grand Prix in Order | Motorsport Wall Art Print Gift
- Regular price
-
£42.00 GBP - Regular price
-
- Sale price
-
£42.00 GBP
Couldn't load pickup availability
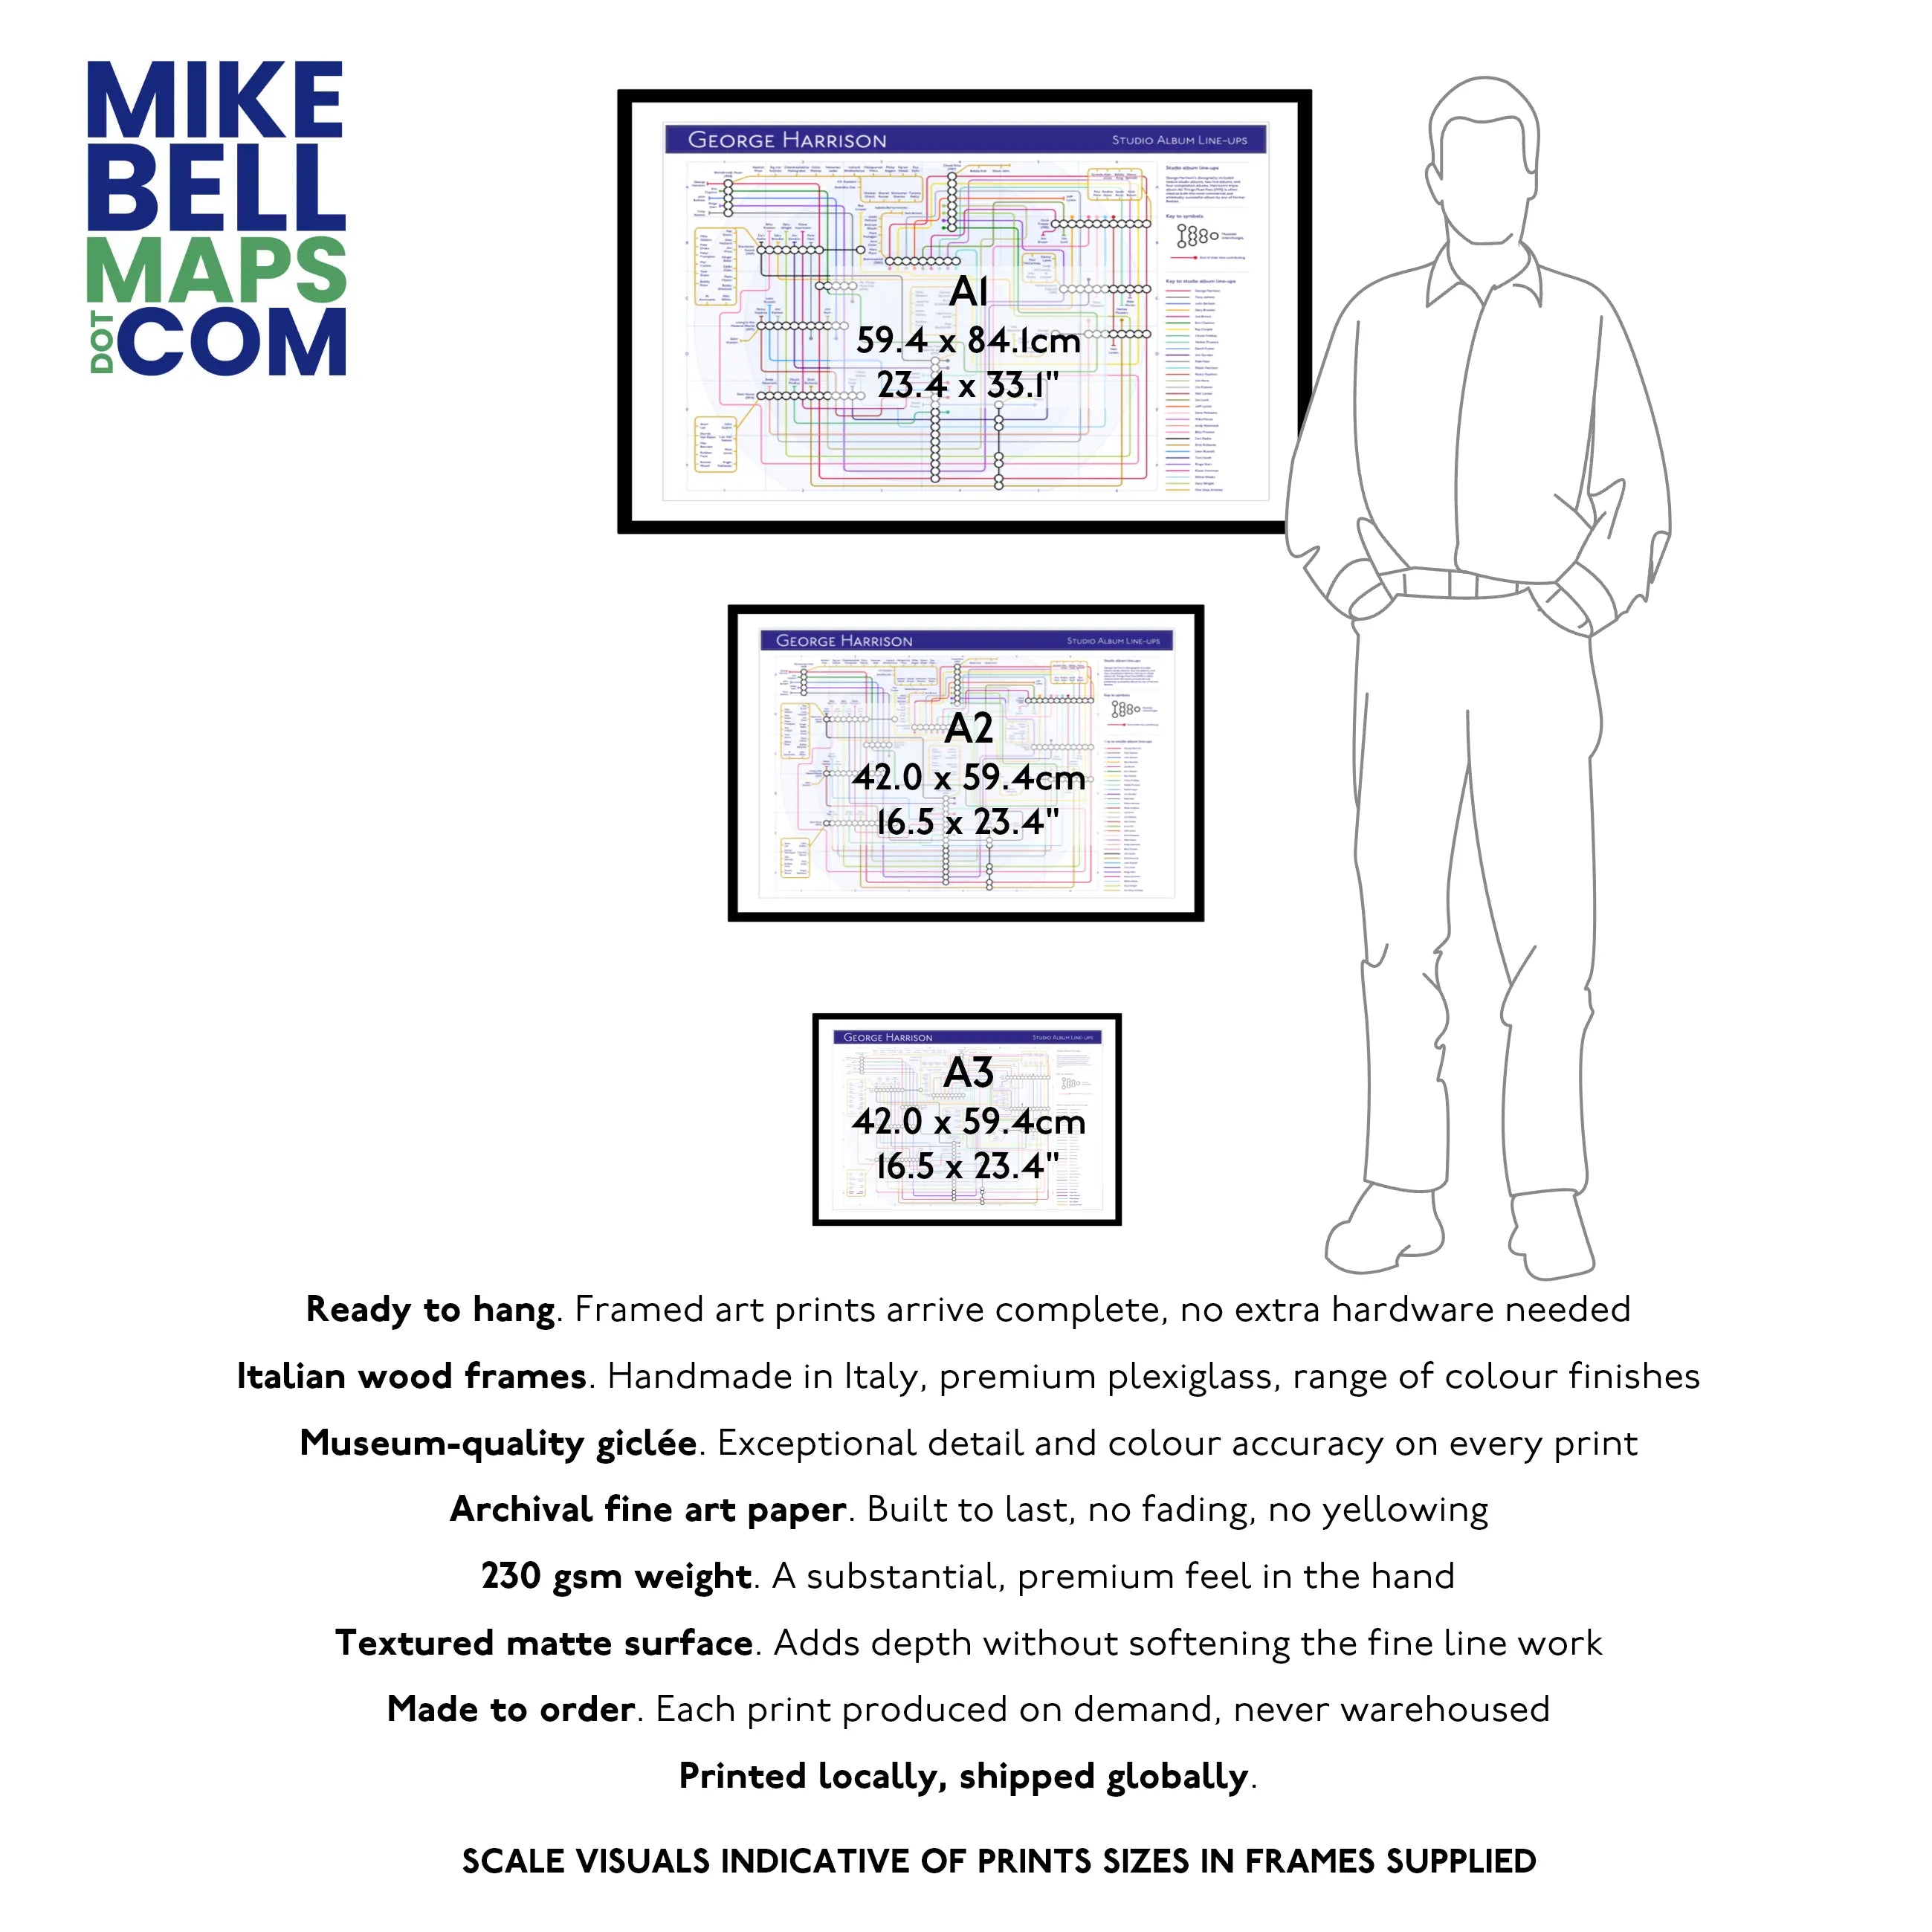
PRINT SIZES: A2 Giclée Art Print - 16x23" / 42x59.4 cm | A1 Giclée Art Print - 23x33" / 59.4x84.1 cm | Visuals are representative of products in frames.
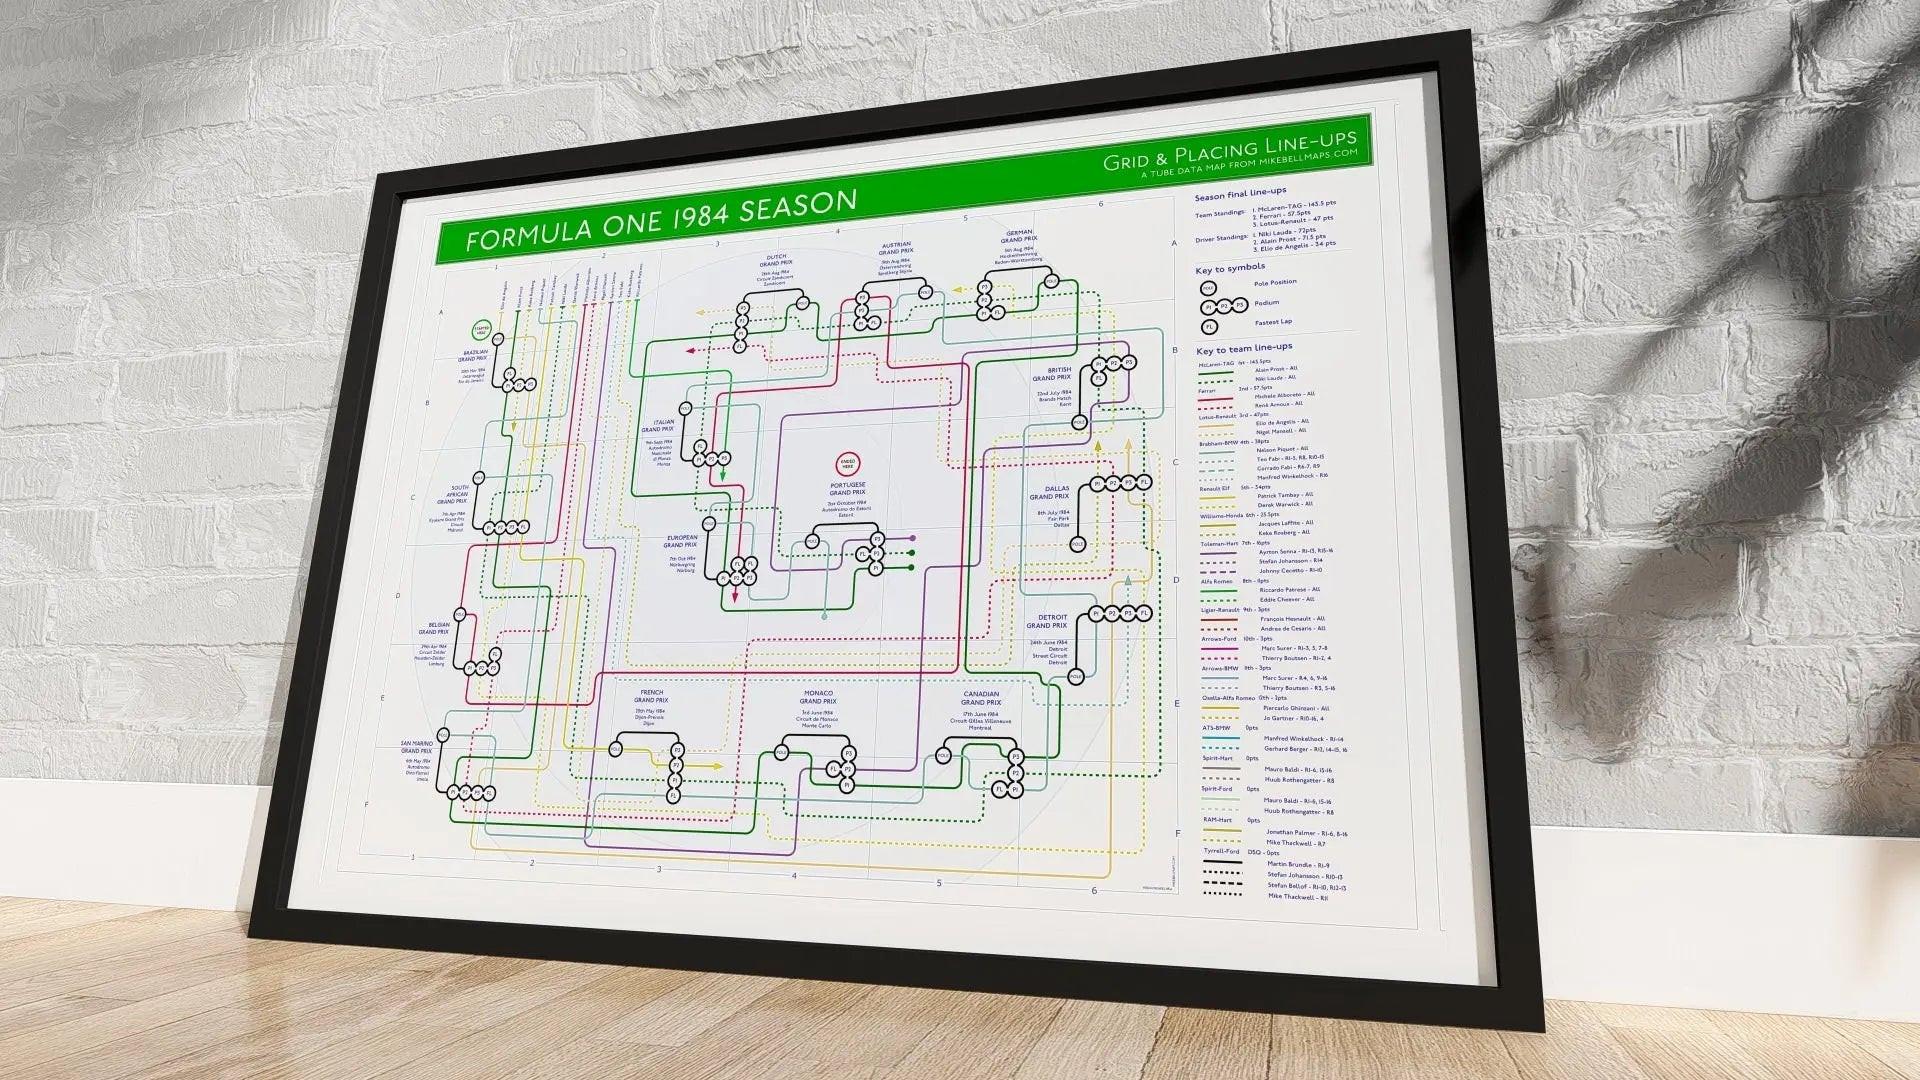
Formula One 1984 Season Map - Every Grand Prix in Order
My Formula One 1984 season map is a motorsport wall art print showing the entire 1984 F1 World Championship as a tube map, designed as a gift for fans who want to see the season in order. Each Grand Prix sits on the map as a station, and every driver and constructor that raced that year runs as a tube line connecting the races they competed in, with the season's title-deciding moments plotted as stops along the championship line.
When I'm researching a Formula One 1984 season map this detailed, I work from FIA records, race archives and decades of F1 history. The 1984 season is one of the most famously close championship contests in the sport's history. Niki Lauda took the title from his McLaren team mate Alain Prost by half a point, the smallest winning margin in F1 history. The map traces all sixteen Grands Prix from the season opener in Rio to the finale in Estoril, with the McLaren-TAG line of Lauda and Prost dominating, alongside Brabham-BMW with Nelson Piquet and Teo Fabi, Lotus-Renault with Elio de Angelis and Nigel Mansell, Ferrari with Rene Arnoux and Michele Alboreto, and the rest of the grid drawn as tube lines connecting the races they raced and the points they scored.
A Motorsport Wall Art Print Gift for Formula One Fans
This is the kind of art print that rewards a close look. Fans tracing the 1984 season from the Brazil opener through the European races, the half-point Monaco Grand Prix that ultimately decided the title, the championship battle through the summer, and the Estoril finale where Lauda took his third world title by half a point, will see exactly how the championship unfolded across the season. It hangs as a season map on a feature wall, a lounge, a study or a garage, and works as a milestone gift for any long-term Formula One fan.
I print every map on archival paper using a Giclée process, in A1 and A2 landscape formats, framed or unframed. You can browse the full Other Tube Maps collection for related sports and process maps.
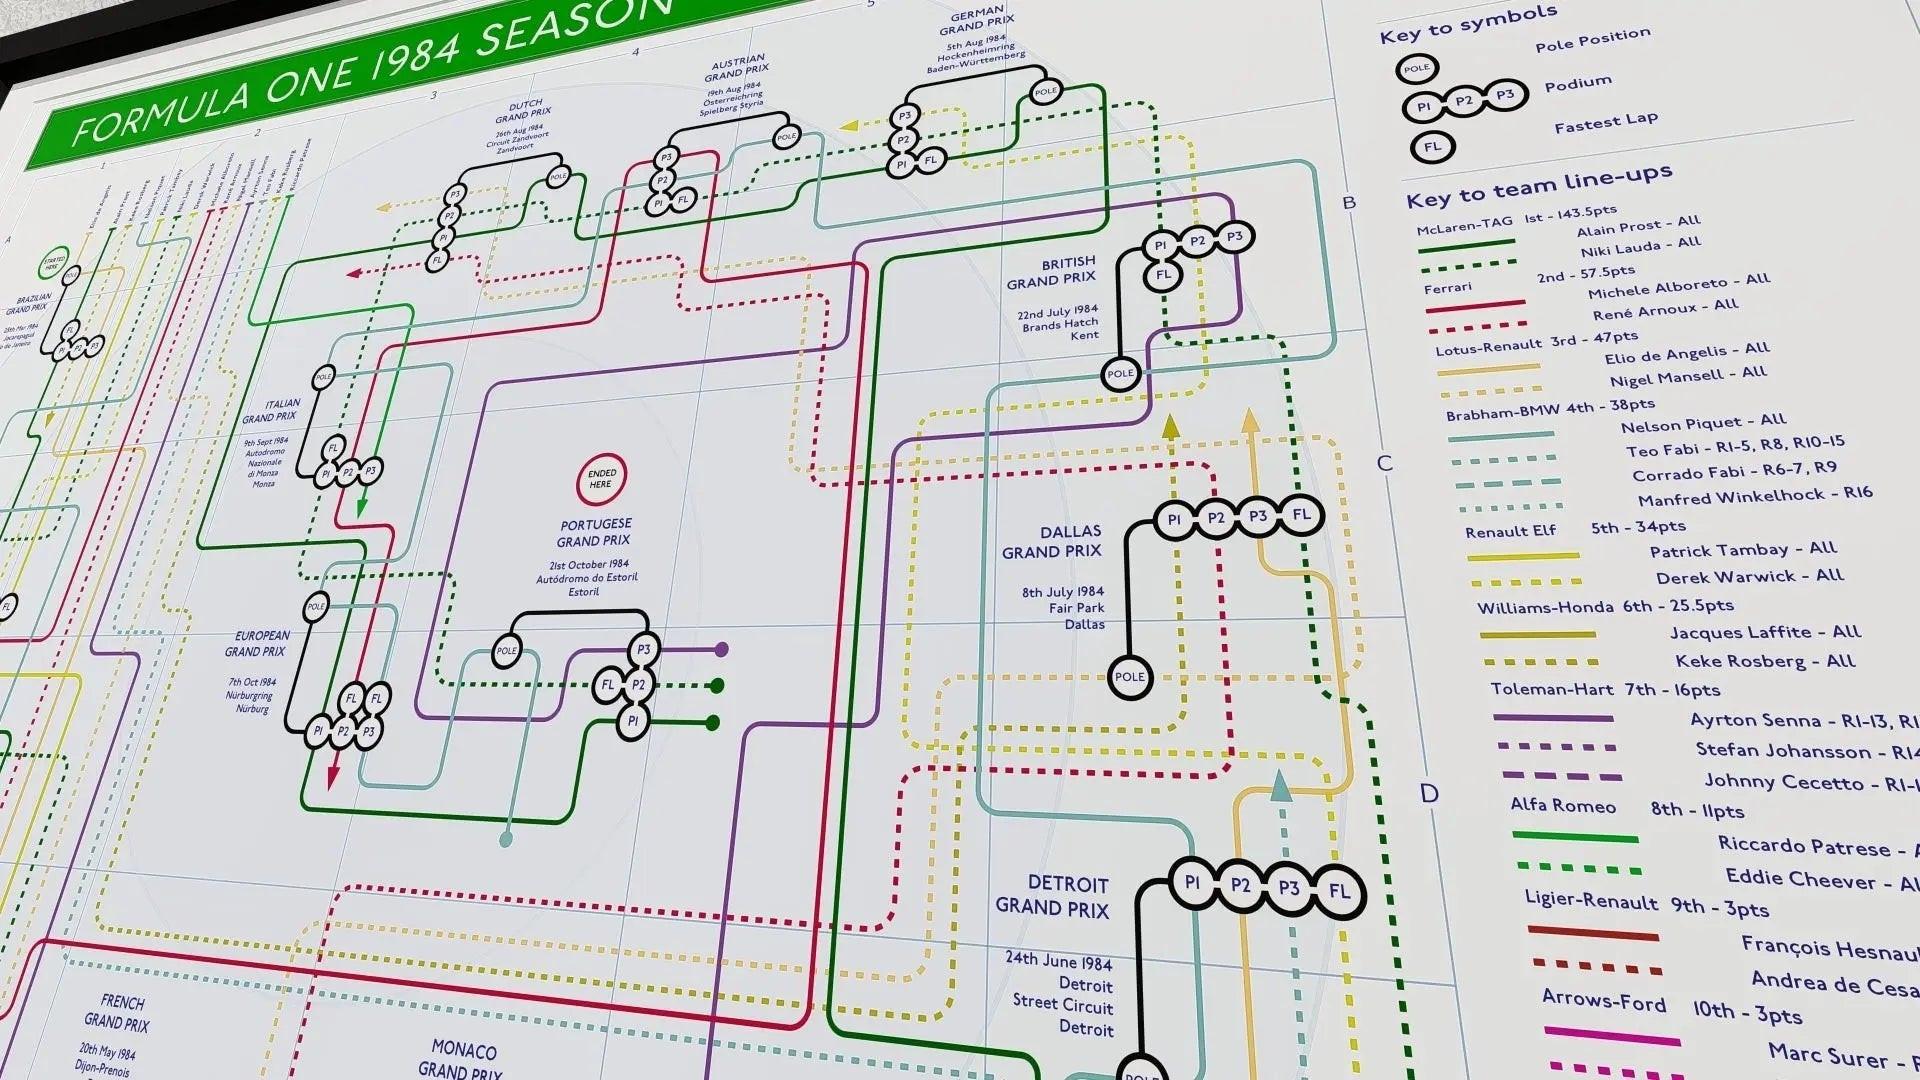
What This Formula One 1984 Season Map Shows
- Every Grand Prix in order: the full 1984 F1 World Championship mapped chronologically, each race positioned as a station on the line.
- Every driver and constructor: the McLaren-TAG title-deciding lines, Brabham, Lotus, Ferrari and the rest of the grid drawn as tube lines connecting the races they competed in.
- The half-point Monaco Grand Prix: visible as the structural moment that decided the championship.
- Research-led design: built from FIA records, race archives and F1 history, not pulled from a Wikipedia summary.
- Giclée wall art print: printed on archival paper, available in A1 and A2 landscape, framed or unframed.
Questions About the Formula One 1984 Season Map
Is this a Giclée wall art print?
Yes. I print every map using a Giclée process on archival paper, which gives a sharp, fade-resistant finish suitable for long-term display.
What sizes does the F1 1984 map come in?
A1 landscape (594 x 841mm) and A2 landscape (420 x 594mm), framed in black or white or supplied unframed.
Does the map show every race in order?
Yes. Every Grand Prix of the 1984 season from Brazil to Portugal is mapped chronologically, with each driver's line moving through the races they competed in.
Is this a good gift for a Formula One fan?
It's designed for fans who already know the era well. The detail rewards close reading, which makes it a strong milestone gift for a long-term collector, a Lauda fan, a McLaren fan or anyone who remembers the half-point championship.
Are other F1 season maps available?
Yes. The Formula One 1986 season map, Formula One 2019 season map and Formula One 2020 season map are all available as companion season prints.
More Maps and Wall Art Prints
You can browse all my Other Tube Maps for related sports and process maps, or explore the full All Map Art Prints collection for the complete catalogue.
Shipping & Fulfilment
No import duties - fulfilled locally in the UK, USA, and EU
Free tracked delivery across the UK, US, and EU. Printed, mounted, framed, and packed in an average of 1-2 business days, then shipped in an average of 3-5 business days. Framing option adds another day. Estimated delivery dates are shown at checkout.
Schedules are subject to workshop workloads across the UK, EU, USA, and other international locations.
Tube Map Art Print Specifications
Every map I sell is printed and framed to archival Giclée standards, matching the level of research and detail that goes into each design. These are proper ready-to-hang fan gifts, not flat-packed kits or plastic shortcuts. Below are the full specifications for the paper, frames, glazing, and canvas options that underpin the production process at mikebellmaps.com.
Tube Map Art Print Specifications at a Glance
- Ready-to-hang framed art prints, fully assembled out of the box
- Handmade Italian wooden frames in solid, real wood
- Available in oak, black and white finishes, with red, yellow and blue on selected products
- Slim modern gallery profile: 1.5cm wide and deep on A2, 2cm wide and deep on A1
- Premium plexiglass glazing, lightweight and shatter-resistant for safe global shipping
- Museum-quality Giclée printing for exceptional detail and colour accuracy
- 230gsm premium fine art paper with a textured matte finish
- Archival, acid-free stock for long-term colour stability
- Stretched canvas option available on a 4cm deep floater frame
- Pre-fitted sawtooth hangers and rubber bumpers, ready for portrait or landscape display
- Made to order, printed locally, shipped worldwide in protective packaging
Printed by Printumo
I work with Printumo, a network of vetted local print partners across the UK, Europe, North America and beyond. Every print in my catalogue is produced to the same museum-quality Giclée standard wherever it is made, with local printing in international markets to reduce shipping miles and avoid unnecessary customs charges for customers.
Paper Specifications
All prints are produced on 230gsm premium fine art paper, an archival-grade, acid-free stock with a textured matte surface that holds the fine line work my discography maps depend on.
- Weight: 230gsm, substantial in the hand, with the heft you would expect from a gallery print
- Finish: Textured matte, natural white
- Surface: Enhances depth without losing print clarity
- Acid-free: Yes, archival grade, designed for long-term colour stability
- Print method: Museum-quality Giclée for exceptional detail and colour accuracy, ideal for the dense typography on my maps, from session musician credits to film plot quotes
Frame Types and Materials
- Material: Solid, real wood construction
- Finishes: Available in oak, black and white, with red, yellow and blue options on selected products
- Poster frames: Handmade Italian wooden frames paired with high-quality plexiglass
- Canvas frames: Specialised 4cm deep floater frames that give the canvas a suspended, gallery-style look
Frame Dimensions and Profile
- A2 (and up to 50 x 70cm): 1.5cm wide, 1.5cm deep, slim modern gallery profile
- A1 (and above): 2cm wide, 2cm deep, a more substantial frame on the larger prints
- Canvas depth: 4cm deep on floater frames
Premium Plexiglass Glazing
Protecting the artwork is the priority, but so is making sure it actually arrives in one piece. Every framed print is glazed with 1 to 2mm premium plexiglass as standard.
- Crystal-clear viewing surface
- Lightweight, which keeps shipping costs and impact down
- Virtually shatterproof in global transit, particularly on the larger A1 prints, where glass becomes a real risk
- Safer to handle when you are hanging or rearranging the print
Assembly and Hanging
- Arrives fully assembled and ready to hang, no extra hardware needed
- Sawtooth hangers pre-installed for quick mounting
- Turn buttons included for easy access to the back panel
- Rubber bumpers fitted to protect walls and keep the frame level
- Suitable for both portrait and landscape display
Canvas Option
For customers who prefer a frameless wall presence, every map is also available as a stretched canvas print on a 4cm deep floater frame. Same Giclée image quality, presented with a suspended, gallery-style depth that works well on larger walls. Ready to hang straight from the box.
Made to Order, Printed Locally, Shipped Globally
Every print is made on demand, never warehoused. That means fresher prints, no overproduction, and the flexibility to keep my catalogue at mikebellmaps.com growing without having to hold stock. Wherever possible, prints are produced as close as possible to the delivery address, which means faster delivery and fewer customs surprises. The same museum-quality Giclée standard whether the print is heading to Brighton or Brooklyn. Packaged in custom-engineered protective packaging for the journey.
For more on local fulfilment, see my locally printed tube maps delivery page.
Tube Map Print Accuracy & Updates
Every one of my prints is the result of my detailed research, cross-referencing, and design refinement. Each tube map is handcrafted to present the most accurate possible picture of an artist’s recording history, a film’s storyline, or a cultural timeline.

I take pride in the precision behind every connection, date, and credit featured across the collection.
Meticulous Research, Human Process
My research combines album liner notes, musicians' inputs, session archives, fan databases, interviews, and verified public sources to ensure each map is factually sound.
However, even the most carefully researched projects can contain minor errors or omissions, especially when dealing with complex discographies and multi-decade histories.

Community Feedback & Collaboration
I actively welcome feedback from fans, collectors, and artists who spot inconsistencies or have new information to share. Each correction helps refine future editions and strengthens the historical accuracy of the maps.
Contributors who provide verified updates receive discounts on future orders as a thank-you for their diligence and support.
Commitment to Quality
Accuracy isn’t just a promise, it’s part of the creative process. Every update and reprint reflects a commitment to truth, design integrity, and respect for the Music, Movie, and other stories represented.
I value the relationship with my customers and the collaboration that ensures these works continue to evolve and stay relevant.
I will always strive to combine artistic expression with documentary accuracy, celebrating creativity through precision and openness.
How to Care for Your Art Print
Thank you for choosing a Mike Bell Maps Giclee Print. To ensure your artwork remains as vibrant as the day it was printed for the next century, please follow these professional handling guidelines:
1. The "Clean Hands" Rule - Giclee prints are created with archival pigment inks that sit on the surface of the 230 gsm paper. Natural skin oils can transfer to the ink. We recommend washing and drying your hands thoroughly before handling or wearing white cotton "archival" gloves if available.
2. Avoid the "Roll-Back" - If your print arrived in a tube, let it flatten naturally. Lay it on a clean, flat surface and place a few heavy, smooth objects (like books) on the corners. Never roll the print tightly in the opposite direction, as this can "stress" the heavy paper fibres and cause creasing.
3. Framing is Protection - To ensure the 100+ year lightfastness guarantee, we recommend framing your print behind UV-protective glass or acrylic. Always use acid-free mounting materials (like the mounts provided in our framed options) to prevent "paper burn" or yellowing over time.
4. Location Matters - While our inks are gallery-standard, prolonged exposure to direct, harsh sunlight can eventually affect any pigment. For maximum longevity, hang your map in a location that avoids consistent direct afternoon sun and high-humidity environments (like bathrooms).
5. Dusting - If your print is unframed, never use water or cleaning sprays. A soft, dry microfiber cloth or a clean squirrel-hair brush is all that is needed to remove surface dust.
Let customers speak for us

A great idea and good quality

Loved this piece! Quality was great and shipped with care, arrived perfectly.

I have a number of these prints now and they are always beautifully printed and pristine
They always come well packed so they remain perfect on delivery

Beautiful unique gift

Brilliant product! I bought this as a gift for my dad’s birthday. He loves it and it’s already displayed proudly on his wall.

Beautiful, good quality, well packaged. And my partner loved it! Thanks so much.

Excellent product and so well packaged

Excellent item, received quickly. Recommended.

Loved this when I saw it in the Uckfield Cinema Restaurant as we live within the map. Very detailed. Will be a great talking point with visitors. Excellent packing and delivery service.

Brilliant! Bought as a present for an old friend - It’s brought so much joy!

Going to make a brilliant 70th birthday present

Cool picture, great gift for a crowded house fan
Great product well packaged and good delivery time.
Bought for my partner for Xmas so he’s not actually seen it yet but I know he’ll love it. Thank you.
Great service. Easy to order, was kept up to date with delivery progress and I was very happy with the quality of the product.

I ordered the Nirvana music poster but have been sent a Joy Division one instead. The poster was intended to be a gift so it is very disappointing to have received the wrong one. I have already emailed about this mistake and have not had a reply. So I am hoping to hear back from you after this review. I still intend to gift the poster so would greatly appreciate a replacement for the correct poster as I am a big fan of this work.